I've recently been working on organizing and upgrading my homelab, which is based on my 4-node Open Compute Cluster. As part of these recent upgrades, I added an Uninterruptible Power Supply to ride out power blips.
I settled on a CyberPower CP1500PFCLCD, which is a 1500VA / 900watt model that outputs a proper sine wave. It's not quite big enough for my homelab; the cluster alone pulls 1200w when running at max capacity, plus additional wattage from my NAS, switch, router and cable modem. But it's enough to keep the smaller components + NAS + desktop node riding through blips. The other two nodes will just have to go without redundant power for now.
CyberPower has some software called PowerPanel which provides a number of features like calibration, realtime stats, automatic shutdown, etc. It's basically CyberPower's version of nutups, or apcupsd for APC UPS’.
The web UI is nice enough, but I'd rather plot the stats in Kibana. Some homelabbers have kindly documented how to get the stats out via SNMP. That'd work, but I have never enjoyed working with SNMP. Luckily, another homelabber discovered that the Web UI get's all it's metrics from a quasi-JSON API endpoint.
Works for me! The rest of this guide will show how to take the data from that endpoint, do some munging and index into Elasticsearch + monitor it in Kibana.
Install PowerPanel
Log into the machine you want to host the PowerPanel daemon. This is the machine that is physically connected to your UPS with a USB cable. This procedure is likely different if you have a UPS that supports networking directly.
Download and install PowerPanel (I used .deb, but there are other options available):
$ wget https://dl4jz3rbrsfum.cloudfront.net/software/powerpanel_132_amd64.deb
$ dpkg -i powerpanel_132_amd64.deb
$ systemctl start ppbed
Then visit http://<your_host>:3052/agent/ to finish the installation. The WebUI will attempt
to detect the UPS, and then ask you some configuration questions.
The daemon didn't apepar to be configured to start on boot, so I went ahead and added it:
$ systemctl enable ppbed
Polling the data
Once the daemon is we need to poll the data on a regular basis, and feed the JSON to Elasticsearch. There are a number of ways you could
tackle this, but I opted to use HttpBeat. Download the latest
release (I used v4.0.0 for this article) and install:
$ wget https://github.com/christiangalsterer/httpbeat/releases/download/4.0.0/httpbeat-4.0.0-amd64.deb
$ dpkg -i httpbeat-4.0.0-amd64.deb
Next, edit the configuration to point it at your Elasticsearch cluster, configure the polling target, etc.
The configuration is located at /etc/httpbeat/httpbeat.yml. My final configuration looked like this:
############################## Httpbeat ########################################
httpbeat:

  hosts:
    # Each - Host endpoints to call. Below are the host endpoint specific configurations
    -
      # Optional cron expression, defines when to poll the host endpoint.
      # Default is every 1 minute.
      #schedule:

      # The URL endpoint to call by Httpbeat
      url: "http://192.168.0.160:3052/agent/ppbe.js/init_status.js"

      # HTTP method to use.
      method: get

      # Type to be published in the 'type' field. For Elasticsearch output,
      # the type defines the document type these entries should be stored
      # in. Default: httpbeat
      document_type: data

#================================ Outputs =====================================

# Configure what outputs to use when sending the data collected by the beat.
# Multiple outputs may be used.

#-------------------------- Elasticsearch output ------------------------------
output.elasticsearch:
  # Array of hosts to connect to.
  hosts: ["192.168.0.199:9200"]
  pipeline: "ups"
  index: "ups-%{+yyyy.MM.dd}"
  template.enabled: false
We configure
HttpBeat to poll http://192.168.0.160:3052/agent/ppbe.js/init_status.js; the IP address
is the host where you've installed the PowerPanel daemon and the rest of the URL is the quasi-JSON
endpoint. If you hit that url in your browser, you'll see something like:
var ppbeJsObj={"status":{"communicationAvaiable":true,"onlyPhaseArch":false,"utility":{"state":"Normal","stateWarning":false,"voltage":"118.0","frequency":null,"voltages":null,"currents":null,"frequencies":null,"powerFactors":null},"bypass":{"state":"Normal","stateWarning":false,"voltage":null,"current":null,"frequency":null,"voltages":null,"currents":null,"frequencies":null,"powerFactors":null},"output":{"state":"Normal","stateWarning":false,"voltage":"118.0","frequency":null,"load":20,"watt":180,"current":null,"outputLoadWarning":false,"outlet1":null,"outlet2":null,"activePower":null,"apparentPower":null,"reactivePower":null,"voltages":null,"currents":null,"frequencies":null,"powerFactors":null,"loads":null,"activePowers":null,"apparentPowers":null,"reactivePowers":null,"emergencyOff":null,"batteryExhausted":null},"battery":{"state":"Normal, Fully Charged","stateWarning":false,"voltage":"24.0","capacity":100,"runtimeFormat":1,"runtimeFormatWarning":false,"runtimeHour":0,"runtimeMinute":33,"chargetimeFormat":null,"chargetimeHour":null,"chargetimeMinute":null,"temperatureCelsius":null,"highVoltage":null,"lowVoltage":null,"highCurrent":null,"lowCurrent":null},"upsSystem":{"state":"Normal","stateWarning":false,"temperatureCelsius":null,"temperatureFahrenheit":null,"maintenanceBreak":null,"systemFaultDueBypass":null,"systemFaultDueBypassFan":null,"originalHardwareFaultCode":""},"modules":null,"deviceId":2}};
Neat! It's almost JSON… in actuality it's a JS variable declaration but we can work with that. To do so, we configure our HttpBeat to use an Ingest Pipeline in Elasticsearch:
output.elasticsearch:
  # Array of hosts to connect to.
  hosts: ["192.168.0.199:9200"]
  pipeline: "ups"
  index: "ups-%{+yyyy.MM.dd}"
  template.enabled: false
The pipeline will allow us to do some simple massaging to make that output a proper JSON object. The pipeline's name
is “ups”. We also configure a custom index name pattern (instead of the default "httpbeat-*") and disable the default
HttpBeat index template because we'll provide our own.
Configure the Pipeline
Before we turn on HttpBeat, we need to setup the ingest Pipeline. I used this pipeline definition:
PUT _ingest/pipeline/ups
{
  "description": "UPS",
  "processors": [
    {
      "gsub": {
        "field": "response.body",
        "pattern": "var ppbeJsObj=(.*);",
        "replacement": "$1"
      }
    },
    {
      "json": {
        "target_field": "status",
        "field": "response.body"
      }
    },
    {
      "script": {
        "lang": "painless",
        "inline": "Calendar cal = Calendar.getInstance(); Date date = Date.from(Instant.parse(ctx['@timestamp'])); cal.setTime(date); cal.setTimeZone(TimeZone.getTimeZone('EST')); ctx.hour = cal.get(Calendar.HOUR_OF_DAY);ctx.price = (ctx.status.status.output.watt / 1000.0 / 60) * 0.1484;"
      }
    },
    {
      "remove": {
        "field": "response"
      }
    },
    {
      "remove": {
        "field": "request"
      }
    }
  ]
}
It's fairly straightforward. Working from the top processor downwards, we:
-
Configure a
gsubprocessor, which regex-powered capture and replace on theresponse.bodyfield. The regex captures everything betweenvar ppbeJsObj=and the semi-colon. It then replaces everything in the field with that capture group. This essentially turns that JS variable declaration into proper JSON -
At this point, we have valid JSON… but it's encoded inside a string. We use the
jsonprocessor to convert theresponse.bodystring field into a real JSON object and place it under thestatusobject. -
The next bit is optional, but makes for more fun dashboarding. We add a Painless script which does two things:
-
First, it finds the hourOfDay from the timestamp field so that we can plot power usage in a heatmap later. There is probably a more elegant way to do this, but my java-fu is a bit weak sometimes.
-
While we're here, we can also calculate the “price” of this 1-minute window. I pay $0.14 per kWh, so
(ctx.status.status.output.watt / 1000.0 / 60) * 0.1484calculates the cost for that 60s of usage. I think… my math may be wrong :) -
We're done with the heavy lifting, now we just do some cleanup by removin the
responseandrequestfield. This just eliminates some fields that we don't intend on graphing (like HttpBeat staus headers, the original json string, etc)
It looks a bit gnarly, but it's really pretty straightforward. I opted to do this stage in an Ingest Processor since it is easily updateable at runtime. I.e. if electricity prices change, I can just update the pipeline and new data will have the new price.
Add the index template
By default, Elasticsearch will attempt to guess the data types for our fields. This works well enough in most cases, but there are a few fields I'd like to explicitly map. I added this template to my cluster:
PUT /_template/ups_template
{
  "order": 0,
  "template": "ups-*",
  "settings": {
    "index": {
      "number_of_shards": "1"
    }
  },
  "mappings": {
    "data": {
      "dynamic_templates": [
        {
          "voltage": {
            "mapping": {
              "scaling_factor": 10,
              "type": "scaled_float"
            },
            "match": "*voltage*"
          }
        }
      ],
      "properties": {
        "price": {
          "scaling_factor": 100,
          "type": "scaled_float"
        }
      }
    }
  },
  "aliases": {}
}
It basically finds any field that contains the string "voltage" and makes it a scaled_float. It also
maps the "price" field as a scaled_float too. I chose scaled floats here because I want some limited floating point values, but don't need the huge dynamic range of true float/doubles. A scaled float is basically a long which applies a scaling factor, so this
compresses much better.
Fire up HttpBeat
With the prep out of the way, fire up HttpBeat:
$ systemctl start httpbeat
Have fun in Kibana
After a few minutes, data should start arriving in your Elasticsearch cluster. All the data will be in the ups-* indices.
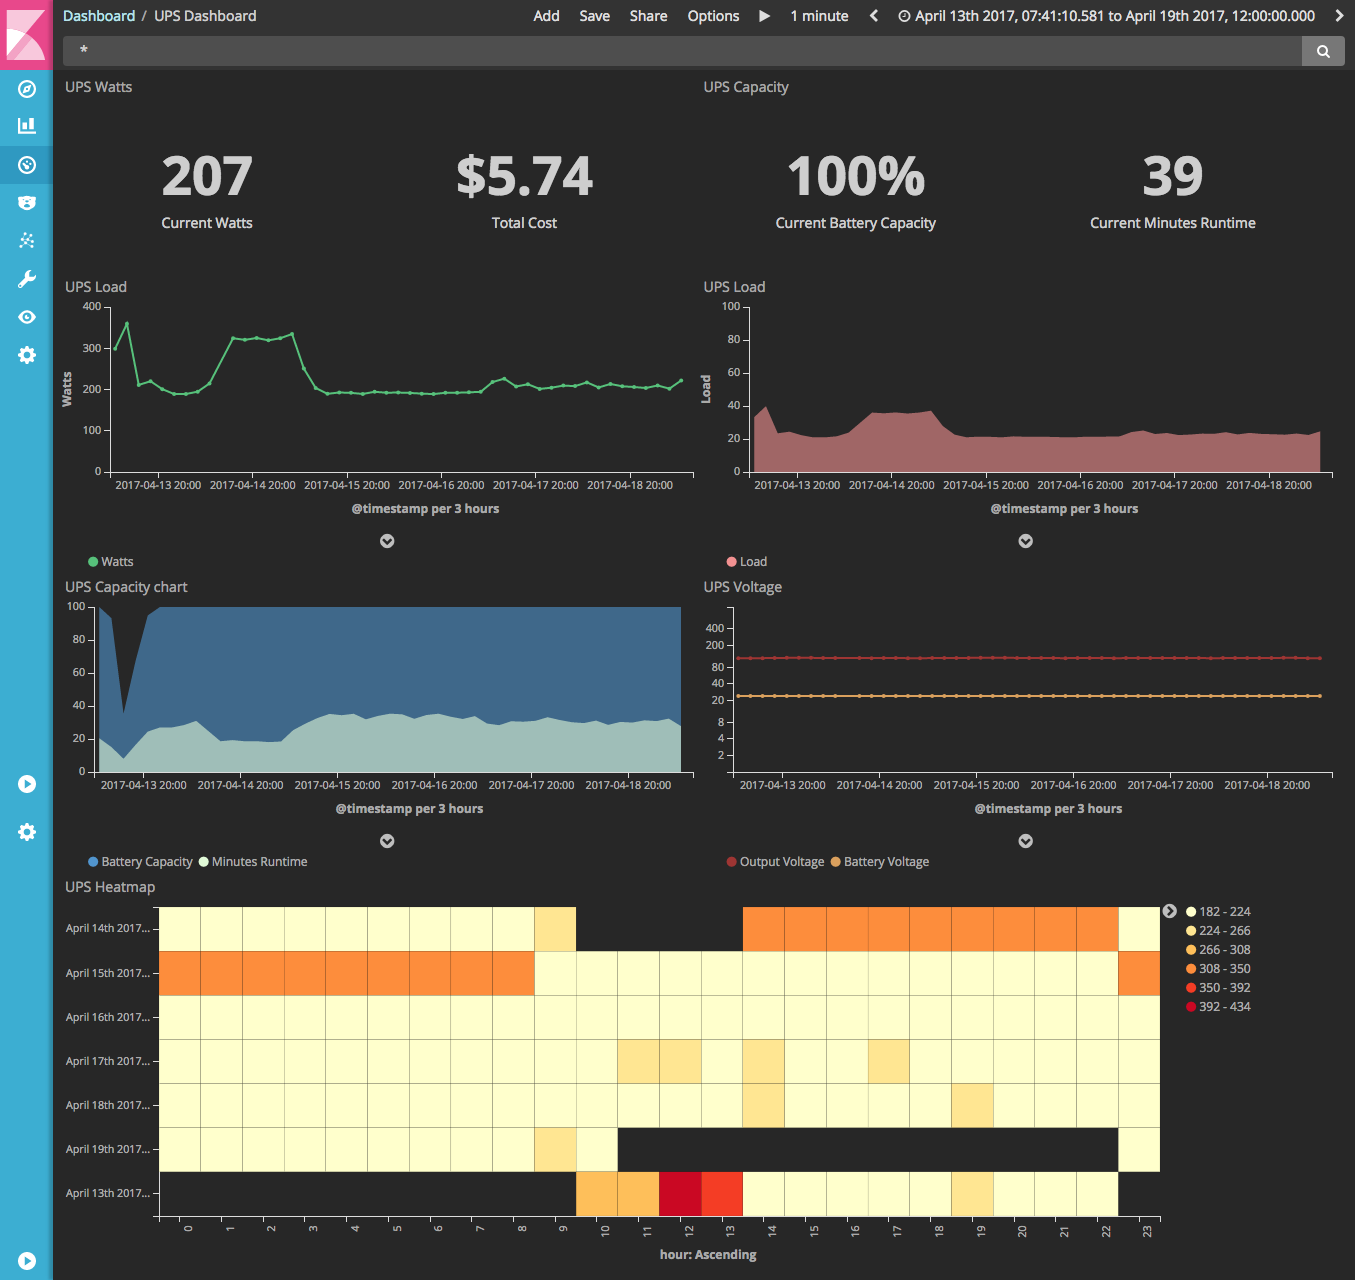
How you choose to graph your data is up to you… my dashboard ended up looking like this:
Addendum: Keeping ppbed alive
Alas, the ppbed daemon has a tendency to die. Well, not die exactly… but get “stuck”. The daemon stays up, and reports values, but a random period of time the values stop updating and will return the same values repeatedly. It seems to take a few hours for that to happen, so I used a brute-force hammer and just restart the daemon hourly :)
I opted to use a systemd timer, but a cronjob or similar would work fine. I created a new service at /etc/systemd/system/restart-ppbed.service:
[Unit]
Description=Restart PowerPanel

[Service]
Type=oneshot
ExecStart=/bin/systemctl try-restart ppbed.service
And a timer at /etc/systemd/system/restart-ppbed.timer:
[Unit]
Description=Restart PowerPanel

[Timer]
OnCalendar=hourly
Persistent=true

[Install]
WantedBy=timer.target
And finally, enabled and started this new “service”:
$ systemctl enable restart-ppbed
$ systemctl start restart-ppbed
:)